We are living in turbulent times. With the pandemic still fresh in our minds, businesses were hit with a fresh wave of economic shocks in 2022. The invasion of Ukraine triggered a spike in gas prices, leading to soaring energy costs across the UK and Europe. This was compounded by record levels of inflation, leaving many consumers struggling to make ends meet.
Many hoped for a return to normal in 2023, but this is looking increasingly unlikely. With experts warning the UK to brace itself for the longest and deepest recession in the G7, it seems that financial risk will be a fact of life for some time to come.
This isn’t just a problem for consumer-facing businesses. It also affects those providing B2B services. Whether you’re extending credit, underwriting insurance, or supplying any other kind of financial service, it’s harder than ever to know which companies are safe to work with.
Basing these decisions on general trends is no longer good enough. You need to take into account every factor, both within the company and in the economy as a whole. This can seem like a daunting task, but we’re here to help. Our Forecast View™ financial modelling lets you simulate a range of market disruptions so that you can spot financial risk in your portfolio before it's too late. Here’s how it works.
![]()
Follow us on LinkedIn for all the latest Company Watch news
The H factor
Forecast View™ won the 2023 CICM Risk Management Award and is a direct descendent of our (also) CICM award-winning COVID Forecast Score. This provided a lifeline for many businesses during the pandemic by allowing them to predict the impact of COVID disruption on their customers and suppliers. Forecast View™ takes this one step further, expanding the range of scenarios for the post-pandemic era.
▶️ Find out more about Forecast View™ - watch our webinar here.
The key to both features is our H-Score®. This is an industry-leading tool for measuring the likelihood of a business failing. We analyse company finances from a range of angles to see how closely they resemble those of companies that have failed in the past. We then give the company a score out of 100. Companies with an H-Score® of 25 or less are placed in the Warning Area, meaning that they carry a high degree of financial risk, and are likely to suffer a distress event.
Let it slide with simple financial modelling
Forecast View™ may be capable of generating complex financial risk models, but using it couldn’t be simpler. Our dashboard is designed to be as intuitive as possible, giving you everything you need to get started immediately.
Simply select a company you wish to assess and you will be presented with a series of sliders, each corresponding to a key metric of company finance:
- Sales revenue
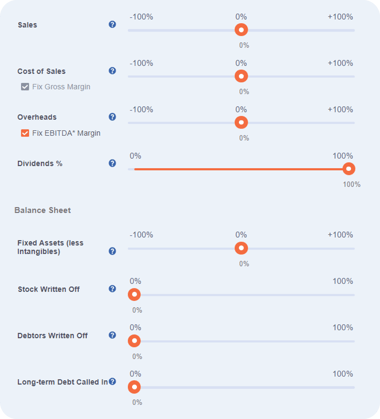
- Sales costs
- Overhead costs
- The amount paid in dividends
- The value of company assets
- Stock and debtors that have been written off
- Long-term debt that has been called in
By dragging these sliders to the left or right, you can adjust each variable by a chosen percentage. Moving a slider will immediately alter the company’s H-Score®, giving you an instant assessment of how these changes would affect its overall financial health. By adjusting the sliders in various combinations, you can build an accurate picture of a company’s resiliency.
Plan for any scenario
You can tinker with these variables to your heart’s content, but there may be times when you need quicker results. That’s why Forecast View™ also comes with a range of built-in scenarios. Choosing one of these will automatically adjust all sliders to reflect the likely impact. This lets you simulate common economic shocks in order to spot the most likely financial risks. Pre-set scenarios include:
-
Margin squeeze - This is a scenario in which costs increase but the company is unable to pass them on to consumers. This causes overall revenue to fall, even if there has been a small increase in sales.
-
Key customer insolvency - This scenario simulates the effect of an important customer going bankrupt. This may cause outstanding debts to be written off, forcing the company to absorb the loss.
-
Pent-up demand - Reopening after a disruption can lead to a surge in demand as customers rush to make up for lost time. If demand is high enough, increased operating costs can be passed onto consumers rather than being absorbed by the company.
Once again, running one of these financial models will automatically adjust the company’s H-Score®. You can compare this to the industry average score to see how financially risky it is compared to others in its industry.
We’ve only scratched the surface here. Explore all of our financial risk solutions here. Forecast View™ is designed to be as in-depth as you need it to be, offering everything from a quick overview to deep dive analysis. Download our PDF guide to learn more about these features and benefits, or get in touch to arrange a free trial and use the tool yourself.
Disclaimer- The past performance of a company is not always an indicator of future success. Read our terms and conditions here.